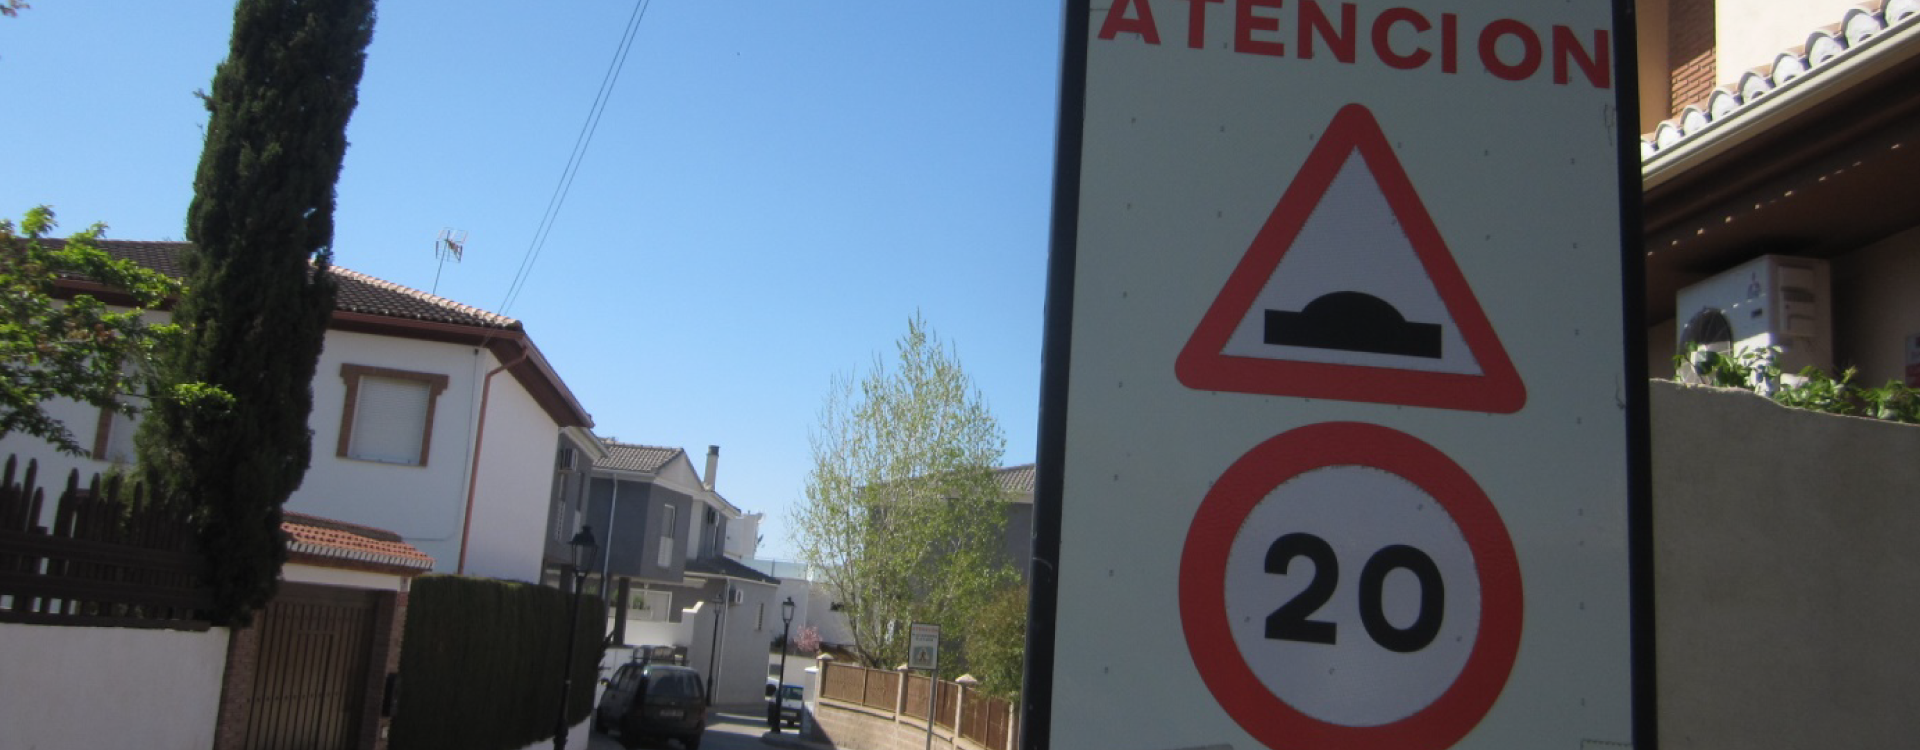
The organizational speed-limit
Pleasurable effects of this approach are often a bigger revenue, lower costs and work that flows easier and quicker. If the maximum speed is reached depends on the driver and how fast your organization can go, wants to go and dares to go.
Operational Excellence can be initiated for different reasons. Our approach is customer-oriented in order to raise our reliability to the highest level; time and money-wise. This approach often results in effortless cost reduction and efficiency improvement.
Why the customer-oriented approach?
An improvement project has an instrumental side and a behavioural side. The instrumental side is the technical solution that usually works out. “Thinking of, developing and placing traffic lights is a project that usually succeeds.”
The most important cause for failing improvement projects is the underestimation of the behavioural side. This could be the resistance of an employee (39%), the lack of support by the management (33%) or inadequately deploying resources (14%) (Source: 3rd Biennial PEX Network report, 2013).
“If the government does not explain WHY there is a maximum speed and if the police does not supervise this speed limit regularly, drivers will not be stimulated to change their behaviour.
An example: Operational Excellence in public transport
Public transport’s client is the traveller. Sometimes the ordering party is regarded as a client, but this ordering party normally attends the needs of the travellers.
So, an improvent project should focus on raising their continuous reliability towards the travellers. This will results in more clients, a higher capacity of vehicles and a more profitable company. It will also result in structuring the internal workflows more.
So what? What happens next?
Imagine;
Bus stop X, scheduled departure time 12:00
Situation A: The bus leaves between 4 minutes early and 10 minutes late.
Situation B: The bus always leaves between 0 minutes early and 2 minutes late.
Situation A will make for a travaller that leaves their location extra early, in order to prevent missing their bus, with the risk of having to wait extra long whenever the bus is late. Additionally, whenever the bus is late, the traveller will most probably be also. What if you need to transfer to a different bus and you only have 2 minutes of transfer-time? An improtant meeting? Woops, I’d rather take the car in situation A.
The difference between situation A and B is just a couple of minutes, but the travel experience of our client can differ immensly. The bigger the variation in actual departure time, the longer the travel and the bigger the risk of missing a connection or having a negative experience.
The effects of a chance of unreliability is researched:
| Regular travellers | Occasional travellers | Non travellers | |
| Decrease in unreliability | 9% more travellers | 22% more travellers | 9% more travellers |
| Increase in unreliability | 17% less travellers | 44% less travellers | – |
(Source: Service Reliability and Urban Public Transport Design, Niels van Oort)
The most important indicators of reliability in public transport are; the spread of regularity (at a high frequence) and punctuality (at a low frequence). A small spread adds to a greater predictabilty. Mainly for occasional and non travellers the expectations of planned departure times is high, which is why regularity and punctuality have a small spread around the planned departure timetables. A small spread makes for a shorter waiting time and also increases the chance of a succesful transfer. TMWalker3 and TMWalker4 both have excellent functions to analyse these traditional indicators.
The media sometimes mentions punctuality numbers of public transport. “Transportation company X reached a 92% punctuality in 2016”. But this is mostly about the departure times of the vehicles, not the travellers. The best punctuality is reached if nobody gets on or off the bus. This only slows them down. A strange situation, a punctual, but empty, bus.
Which is why we added new KPIs to TMWalker4. For example, the deviation in traveltime and travel punctuality of the traveller – starting at the first bus stop and ending at the last. Yes, including their (missed) transfer. This makes for the most important rides to be shown and this shows the company what to focus on. That’s a customer-oriented view.
Examples of results:
– 15% of the travellers is waiting at bus stop X for at least 5 minutes.
– 1500 travellers were waiting for at least 5 minutes at the same bus stop, over the past month.
– The average waiting time after planned departure time was 3 minutes for stop X.
– There were 7500 waiting minutes at stop X over the past month.
– There was at least 2% of transfers at bus stop X.
– 15% of travellers departs too early from bus stop X.
The preliminary phase (door till departure stop) and the follow-up phase (final stop till door) mainly fall out of the reach of the transfer company, but it is interesting. Ideas on how to measure these reliable are most certainly welcome.
The motto “In pursuit of Operational Excellence” made for a more extensive TMWalker4. The customer-oriented view is ever changing, influenced by economy and environment. Feel free to ask anything!


0 Comments