
Over the past few months, Wouter Leeuw (data science intern at AnalyeData, one of the companies we share our office building with) has been working away on a Berco Car Carpets manufacturing dataset. The goal of the research: to create a simulation model of the actual manufacturing process as correct as possible and find points of improvement. He got to present his findings at Berco last Tuesday.
We have blogged about the importance of qualitatively good data, the possibilities of business events, and the future of process mining before. This research has been a great way to find applications of the data that we are already collecting in and around the production halls at Berco. A good test to see if we are heading in the right direction.
The base
At the core of this research, obviously, lies the data. This data encompassed over 62.800 events, linked to over 6.175 different work orders. After defining the used and needed concepts, the data was cleaned. This was done to prevent accidental logging mistakes from cluttering the analysis. These would create a distorted picture after aggregation.
Before starting the aggregation, Wouter calculated some piler statistics to use as a base-line, as you will, to test how the created simulation model related to reality. For example; what is the average throughput? What is the average production time per order? When the results from the model would strongly deviate from these numbers, it would indicate that there’d be something wrong.
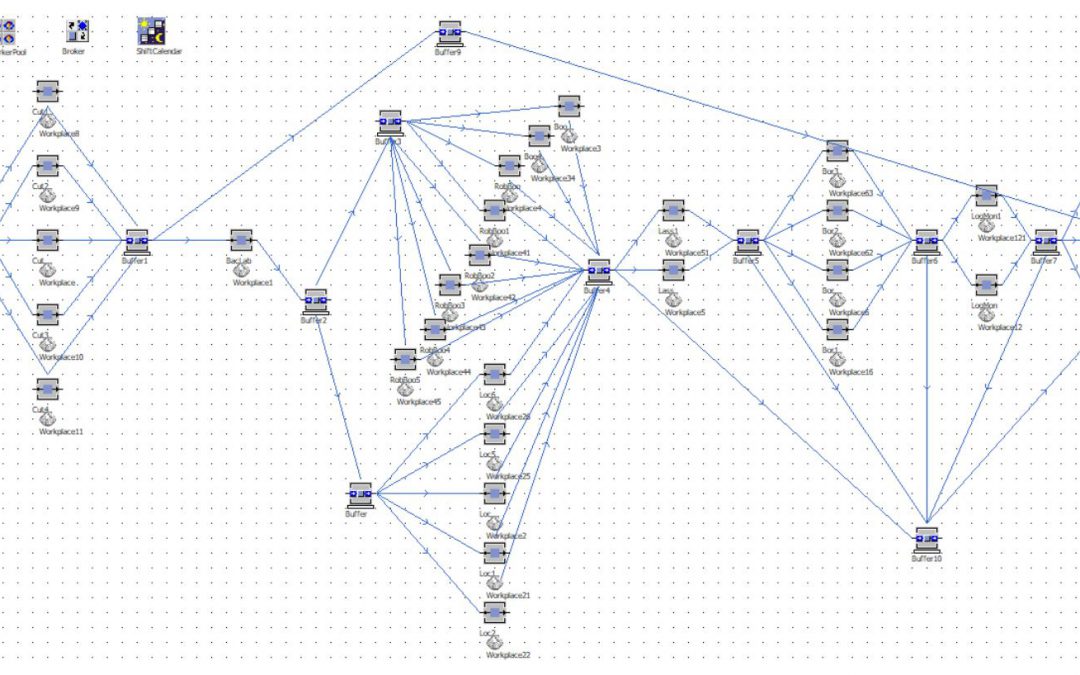
The model
Once this base had been made, it was time for the so-called ‘process extraction’; finding the actual process from the hall. This ‘process flow’ was found using a variant analysis across the event log, using PM4Py. The results of these variant analyses are different paths a work order can take through the production process and how frequently these paths are taken.
Based on these paths and the most occurring starting and ending points Wouter formed a general production model. He kept in mind the limitations concerning the parallel execution of tasks. Some workstation tasks cannot be executed simultaneously.
As a last check to see if the process model was reliable and representative, it was cross-checked with the most often occurring paths. Once it clearly followed the modeled process, it was deemed representative.
Visualisation and optimalisation
The next step was translating this representative model into Plant Simulation. Plant Simulation is Siemens software for modeling, simulating, analyzing, visualizing, and optimizing manufacturing systems and processes. A perfect match with this research some would say.
After running some simulations the bottlenecks presented themselves pretty quickly. Consequentially, the software allowed to play with these bottlenecks; you can ‘easily’ add an extra production machine or an extra team member and see what the results would be.
Conclusion
The overall conclusions we could draw from this project:
- The data are collecting is very valuable
- We are collecting the data in the right manner
- This allows for process mining
- And process mining has an obvious added value; through the practical results and the what-if scenario’s that we can calculate.